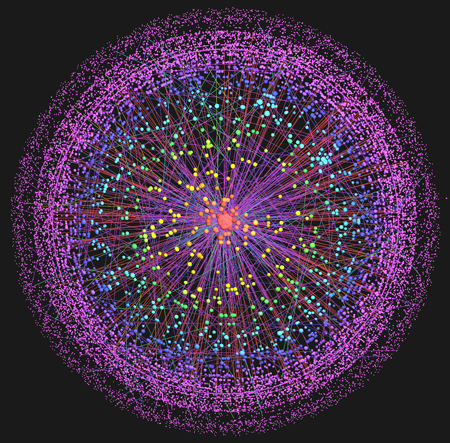
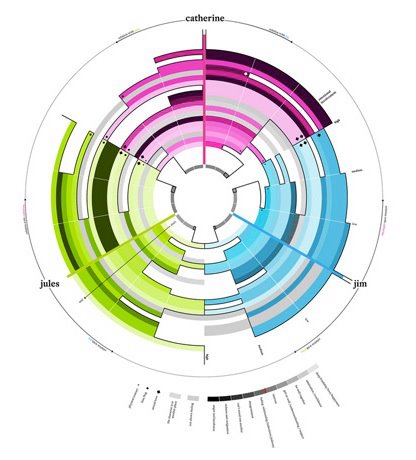
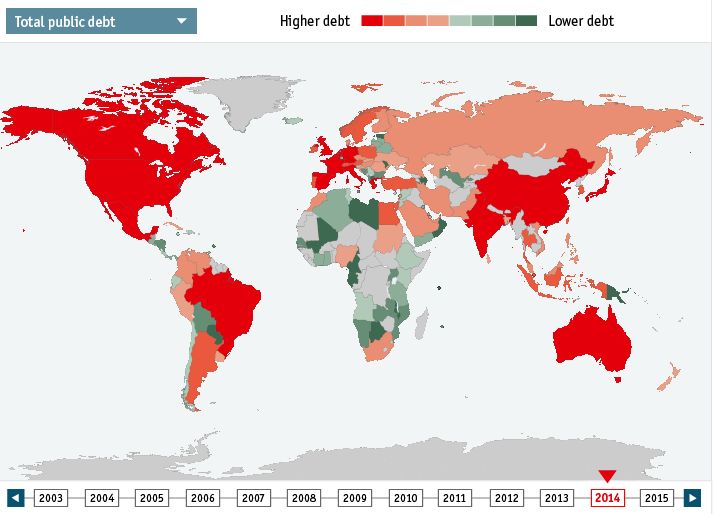
Šestnáct zajímavých tipů na vizualizační nástroje volně ke stažení. Praktická ukázka, jak funguje například Google Data Explorer, je ZDE.
A free download. Available for Windows, Mac and Linux.
____________________________________________________________
Create charts and place them on a website.
____________________________________________________________
Allows creation of several types of graphs and charts, which can be downloaded in .png, .jpg, .pdf or .csv format. Fairly intuitive with several options for changing the look of the chart. One drawback: It doesn’t allow creation of summaries or drawing of arrows or other boxes on the chart canvas.
____________________________________________________________
An online tool for creating diagrams. It allow several people to work on the same document at once. Once a diagram is complete, it can be embedded, linked or saved as a .png file. Requires registration, but it’s free.
____________________________________________________________
A free download, but not for commercial use.
____________________________________________________________
An open creative commons that allows users to share data.
____________________________________________________________
A free download.
____________________________________________________________
Allows creation of diagrams, flow charts and technical drawings.
____________________________________________________________
Most useful for the data Google already has loaded. You can upload your own data, but it must be formatted in dataset publishing language. Google has a forum to help if you want to give it a go.
____________________________________________________________
An easy online chart builder.
____________________________________________________________
Allows creation of diagrams, flow charts, organizational charts and the like. Saves files in .jpg or .png format. Requires registration, but it’s free.
____________________________________________________________
Part of IBM, Many Eyes offers tools for creating maps, charts and diagrams, and for analyzing text (word clouds and tag clouds, for example). It offers many examples of how to turn data into visual information. You can input data or upload it, but you will have to register first. (It’s free.)
____________________________________________________________
A free download.
____________________________________________________________
Create interactive maps and charts. Free downloads of map-making software and graph-making software. Also has a free download of software with statistical data about countries. The tools are powerful (and will require time to learn), but the charts can also become overly complicated if you aren’t careful.
____________________________________________________________
A free download. Allows creation of interactive graphs and charts. ____________________________________________________________
Open-source desktop publishing software roughly equivalent to InDesign or Quark. Works with Windows, Mac, Linux and other operating systems.
____________________________________________________________
Zdroj: Journalism Tech






Charts is best way to represent data. This article is awesome.
Thanks